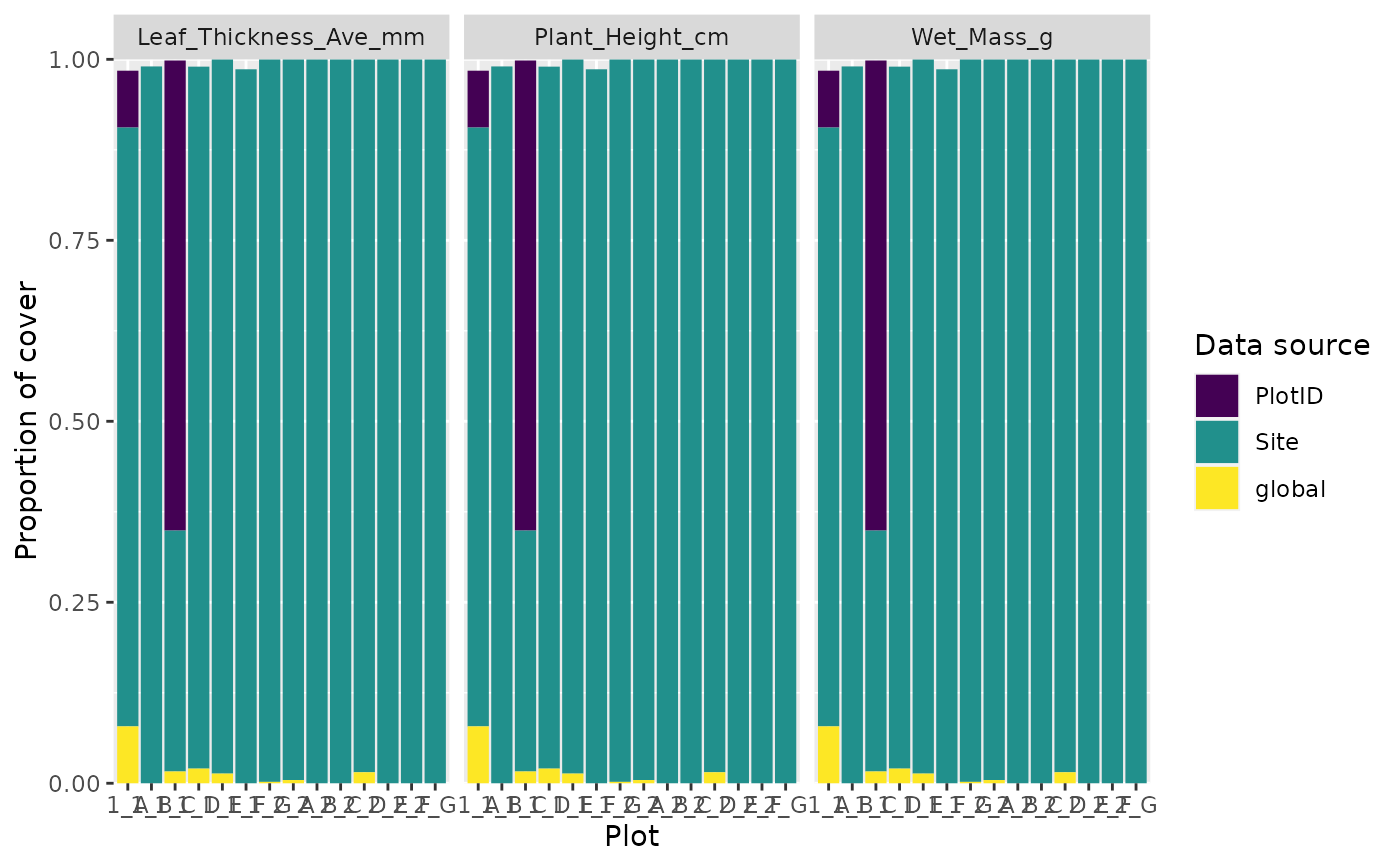
Function calculates the trait coverage of the community for each level of the sampling hierarchy and makes a barplot.
Shows at which level the data are coming from in each plot.
# S3 method for filled_trait
autoplot(object, other_col_how, ...)
Arguments
- object
output from
trait_fill().- other_col_how
what to do with the other columns in other data. Options are to
filterby one of the columns, add them to the x-axis,facetby them, or toignore.- ...
optional filters for use with
other_col_how = "filter"
Value
a ggplot2 plot