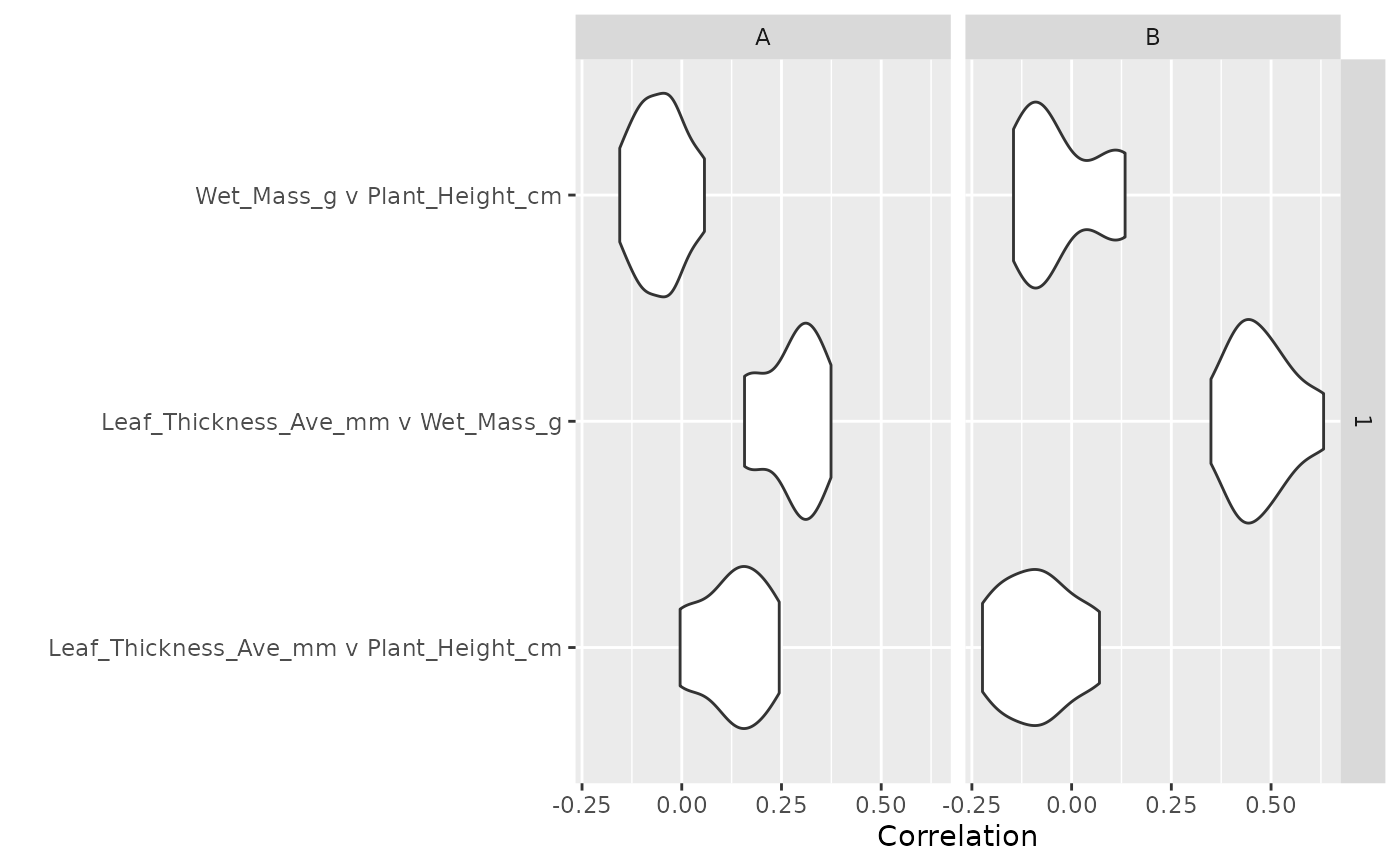
Function for nonparametric bootstrap resampling to calculate community weighted trait correlations, other bivariate or multivariate statistics
trait_multivariate_bootstrap(
  filled_traits,
  nrep = 100,
  sample_size = 200,
  raw = FALSE,
  id = "ID",
  fun
)
Arguments
- filled_traits
output from the trait_fill function.
- nrep
number of bootstrap replicates
- sample_size
bootstrap size
- raw
logical; argument to extract the raw data of the trait distributions. The default is
raw = FALSE. Ifraw = TRUE,nrepis restricted to 1 to avoid memory issues.- id
column name of unique identifiers of each leaf
- fun
bivariate or multivariate function to apply
Value
a tibble with columns for the elements of the scale_hierarchy,
and a list column result which includes the output of fun.
Details
The observed and filled leaves are re-sampled in proportion to
their weights, e.g. the abundance of a species or the biomass.
Values across all individuals in a community are
resampled sample_size times to incorporate the full
spectrum of trait variation, generating nrep trait distributions.
The function fun is applied to the trait distribution at the finest level
of the filled trait hierarchy.
Note that due to the flexibility of this function,
the output CAN NOT be summarized using
trait_summarise_boot_moments.
Examples
require(dplyr)
require(tidyr)
#> Loading required package: tidyr
require(ggplot2)
require(purrr)
#> Loading required package: purrr

data(community)
data(trait)

filled_traits <- trait_fill(
  comm = community |>
    filter(
      PlotID %in% c("A", "B"),
      Site == 1
    ),
  traits = trait,
  scale_hierarchy = c("Site", "PlotID"),
  taxon_col = "Taxon", value_col = "Value",
  trait_col = "Trait", abundance_col = "Cover",
  complete_only = TRUE, leaf_id = "ID"
)

# Note that more replicates and a greater sample size are advisable
# Here we set them low to make the example run quickly
boot_traits <- trait_multivariate_bootstrap(filled_traits,
  fun = cor,
  nrep = 10,
  sample_size = 100
)

boot_traits_long <- boot_traits |>
  mutate(correlations = map(result, ~ cor_to_df(.x))) |>
  select(-result) |>
  unnest(correlations)

boot_traits_long |>
  ggplot(aes(x = paste(row, "v", col), y = value)) +
  geom_violin() +
  facet_grid(Site ~ PlotID) +
  coord_flip() +
  labs(y = "Correlation", x = "")
