Plots the fluxes, fit and slope in facets with color code indicating quality flags This function takes time to run and is optional in the workflow, but it is still highly recommended to use it to visually check the measurements. Note that 'flux_plot' is specific to the fluxible package and will work best with datasets produced following a fluxible workflow.
Usage
flux_plot(
  slopes_df,
  f_conc = f_conc,
  f_datetime = f_datetime,
  color_discard = "#D55E00",
  color_cut = "#D55E00",
  color_ok = "#009E73",
  color_zero = "#CC79A7",
  scale_x_datetime_args = list(date_breaks = "1 min", minor_breaks = "10 sec",
    date_labels = "%e/%m \n %H:%M"),
  f_ylim_upper = 800,
  f_ylim_lower = 400,
  f_plotname = "",
  f_facetid = "f_fluxid",
  facet_wrap_args = list(ncol = 4, nrow = 3, scales = "free"),
  longpdf_args = list(ncol = 4, width = 29.7, ratio = 1),
  y_text_position = 500,
  print_plot = "FALSE",
  output = "print_only",
  ggsave_args = list(),
  arrange_col
)
Arguments
- slopes_df
dataset containing slopes, with flags produced by flux_quality
- f_conc
column with gas concentration
- f_datetime
column with datetime of each data point
- color_discard
color for fits with a discard quality flag
- color_cut
color for the part of the flux that is cut
- color_ok
color for fits with an ok quality flag
- color_zero
color for fits with a zero quality flag
- scale_x_datetime_args
list of arguments for scale_x_datetime
- f_ylim_upper
y axis upper limit
- f_ylim_lower
y axis lower limit
- f_plotname
filename for the extracted pdf file; if empty, the name of
slopes_dfwill be used- f_facetid
character vector of columns to use as facet IDs. Note that they will be united, and that has to result in a unique facet ID for each measurement. Default is
f_fluxid- facet_wrap_args
list of arguments for facet_wrap, also used by facet_wrap_paginate in case
output = "pdfpages- longpdf_args
arguments for longpdf in the form
list(ncol, width (in cm), ratio)- y_text_position
position of the text box
- print_plot
logical, if TRUE it prints the plot as a ggplot object but will take time depending on the size of the dataset
- output
"pdfpages", the plots are saved as A4 landscape pdf pages;"ggsave", the plots can be saved with the ggsave function;"print_only"(default) prints the plot without creating a file (independently fromprint_plotbeing TRUE or FALSE);"longpdf", the plots are saved as a pdf file as long as needed (faster than"pdfpages")- ggsave_args
list of arguments for ggsave (in case
output = "ggsave")- arrange_col
character vector of columns to use to reorder the facets. If NULL (default), facets are ordered by the datetime of the measurement.
Value
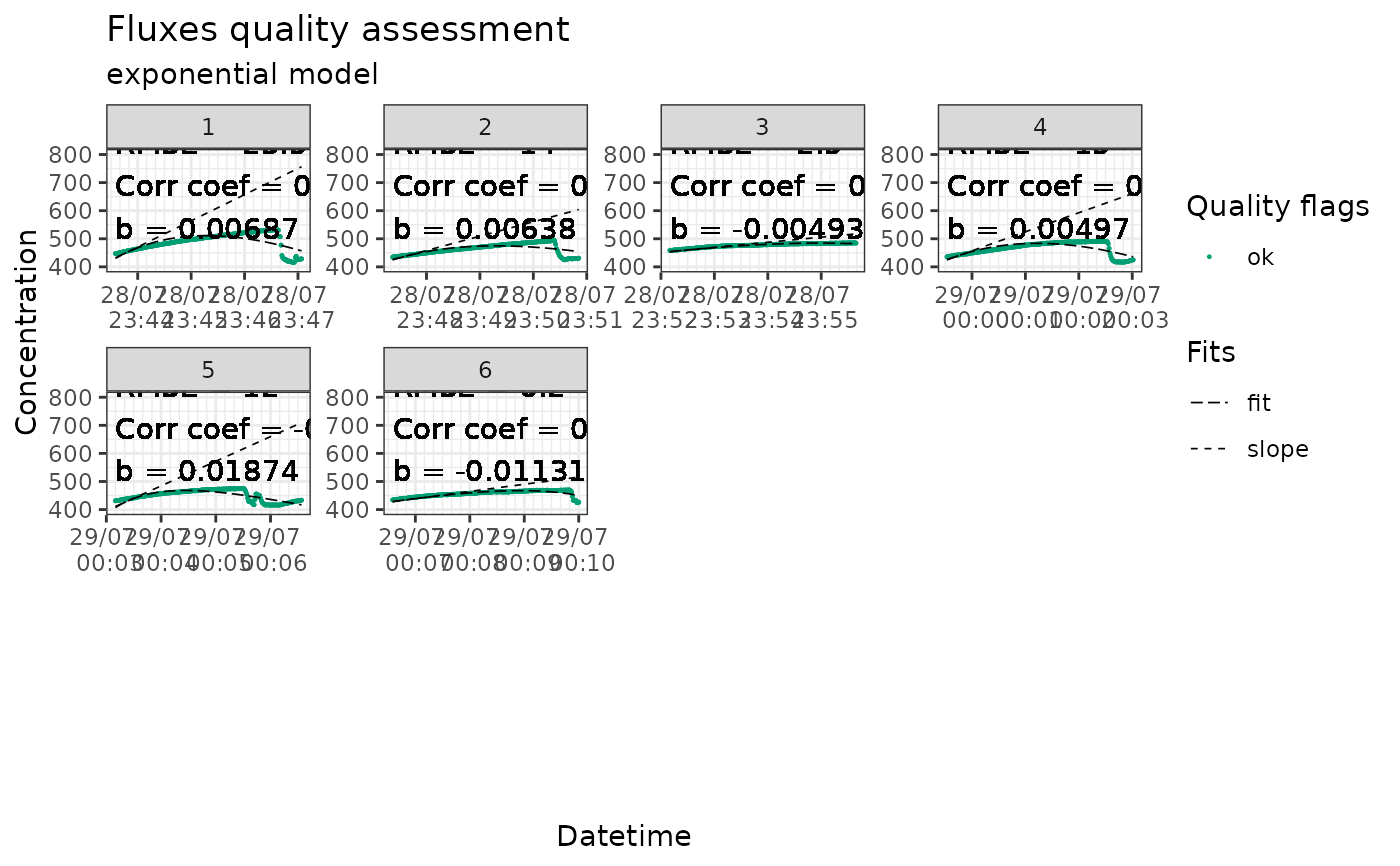
plots of fluxes, with raw concentration data points, fit, slope,
and color code indicating quality flags and cuts. The plots are organized
in facets according to flux ID, and a text box display the quality flag and
diagnostics of each measurement.
The plots are returned as a ggplot object if print_plot = TRUE;
if print_plot = FALSE it will not return anything but will produce a file
according to the output argument.
Details
output = "pdfpages" uses
facet_wrap_paginate, which tends to be
slow and heavy. With output = "longpdf, a long single page pdf is exported.
Default width is 29.7 cm (A4 landscape) and is will be as long as it needs
to be to fit all the facets. The arguments ncol and ratio in
longpdf_args specify the number of columns and the ratio of the facet
respectively. This method is considerably faster than pdfpages, because
it bypasses facet_wrap_paginate, but is a bit less aesthetic.
Examples
data(co2_conc)
slopes <- flux_fitting(co2_conc, conc, datetime, fit_type = "exp_zhao18")
#> Cutting measurements...
#> Estimating starting parameters for optimization...
#> Optimizing fitting parameters...
#> Calculating fits and slopes...
#> Done.
#> Warning:
#>  fluxID 5 : slope was estimated on 205 points out of 210 seconds
#>  fluxID 6 : slope was estimated on 206 points out of 210 seconds
slopes_flag <- flux_quality(slopes, conc)
#>
#>  Total number of measurements: 6
#>
#>  ok 	 3 	 50 %
#>  discard 	 2 	 33 %
#>  zero 	 1 	 17 %
#>  force_discard 	 0 	 0 %
#>  start_error 	 0 	 0 %
#>  no_data 	 0 	 0 %
#>  force_ok 	 0 	 0 %
#>  force_zero 	 0 	 0 %
#>  force_lm 	 0 	 0 %
#>  no_slope 	 0 	 0 %
flux_plot(slopes_flag, conc, datetime)
#> Plotting in progress